Korea's Poorest Households Cut Education Spending by a Fifth This Spring. Their Grocery Bill Rose One Per Cent.
Every Korean outlet ran the same story: food costs are hitting the poor three times harder than the rich. The finding underneath it is real. The number is not — there are at least four different 'three times' in circulation, and two of them contradict each other. Go one level down into the same government table and the poorest fifth's grocery spending barely moved. What moved was healthcare, housing and eating out, and what gave way was their children's education.
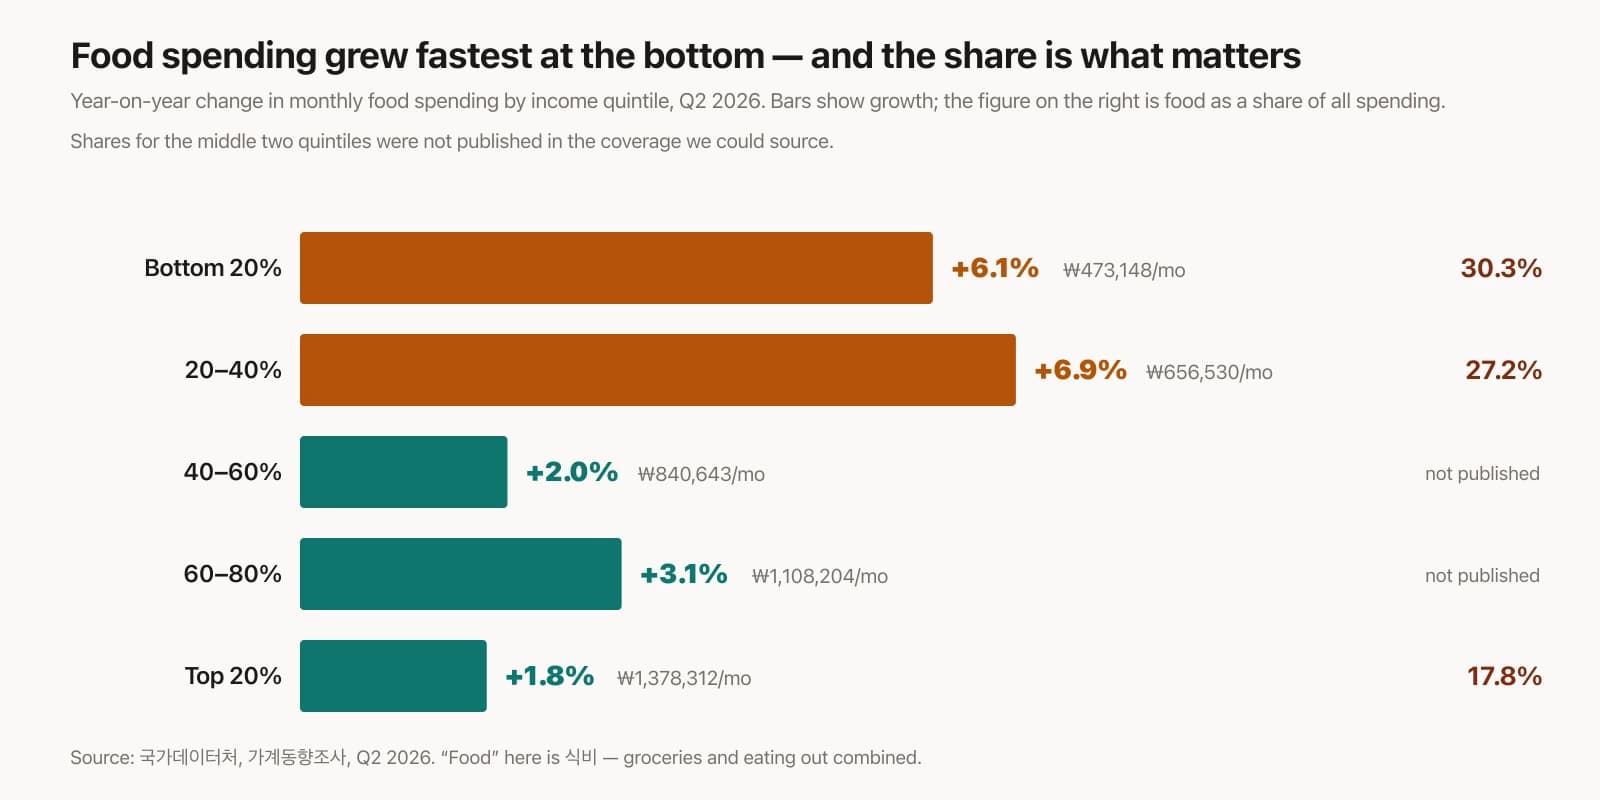
On 30 August, Korean newspapers published the same story from the same table. Food costs, they reported, are hitting the poorest households roughly three times as hard as the richest.
The table is real. It is the 가계동향조사, the household income and expenditure survey, second quarter of 2026, published by 국가데이터처. And the headline finding does hold up: the bottom fifth of Korean households now spend 30.3 per cent of everything they spend on food. The top fifth spend 17.8 per cent.
That gap is the thing worth knowing, and it is not in dispute here.
The three times is a different matter. Go looking for it and you find at least four:
- 3.8× — food-spending growth, comparing the second quintile's 6.9 per cent against the top quintile's 1.8.
- 2.7× — the share of total spending going on vegetables.
- 2.5× — the same for seafood.
- 3.7× or 4.4× — the same for grain, depending which outlet you read. Those two are not rounding variants of each other. They rest on different underlying numbers and we could not reconcile them.
None of them is three. "Three times" is a round number that no single statistic in the release actually produces, and it is doing a lot of work.
That is a small thing. What is underneath it is not.
The number that stops the story
Here is the figure that made us go back to the primary release.
For the bottom fifth of Korean households, spending on 식료품·비주류음료 — groceries and non-alcoholic drinks, the actual supermarket bill — was ₩289,000 a month in the second quarter, up 1.0 per cent on a year earlier.
One per cent. Below inflation. In the quarter that produced a national news cycle about food prices crushing the poor.
The 6.1 per cent figure reported for the same households is 식비, a broader category that folds in eating out. And when you separate the two, almost the entire increase is on the other side of the line: 음식·숙박 — restaurants and accommodation — rose 15.0 per cent, to ₩187,000.
We want to be careful about what that does and does not show, because the honest answer is that we do not fully know. It could be more meals bought rather than cooked, which for elderly one-person households — heavily represented in these quintiles — is often the cheaper option once you count a single portion's waste. It could be restaurant prices, though the cheap end of Korean eating out rose about four per cent, not fifteen. It could partly be who is in the bottom fifth this year versus last, since quintile membership shifts between periods. We could not resolve it, and the release does not answer it.
But it does mean one thing plainly. The story that the poorest are being crushed at the supermarket checkout is not what this table says. Their supermarket bill rose one per cent.
What actually moved
Set the bottom quintile's quarter out in full and a different picture appears — harder than the one in the headlines, not softer.
Their disposable income rose 7.5 per cent, to ₩1,094,000 a month. That is a real gain, and it came substantially from transfers: fuel subsidies, pensions.
Their spending rose 5.2 per cent, to ₩1,372,000.
Which leaves them ₩277,000 short every month. Their average propensity to consume was 125.3 per cent — for every ₩100 of disposable income, ₩125 went out. That figure improved by 2.7 points on the year and is still a household spending a quarter more than it takes in.
Where did it go? Four categories: food, housing and utilities, healthcare, and eating out. Together ₩913,000 — 66.5 per cent of everything they spent. Food and housing alone took 40.8 per cent.
Within that: healthcare +13.5 per cent. Housing, water and fuel +6.5 per cent. Groceries, as above, +1.0.
And then the part that is genuinely difficult to read:
- Education: −21.2 per cent.
- Recreation and culture: −8.7 per cent.
- Communications: −5.1 per cent.
The poorest fifth of Korean households did not absorb this quarter by economising at the supermarket. They absorbed it by cutting their children's education by more than a fifth.
That is a worse finding than the one everybody printed, and it is in the same table.
The other number in the same release
There is one more thing in this data, and it cuts directly against the way the week was reported.
The income quintile ratio — the top fifth's income divided by the bottom fifth's — fell to 4.97. That is the lowest it has been since the current survey method began in 2019.
By the standard headline measure, Korean income inequality in the second quarter of 2026 was the narrowest on record.
Both things are in the same publication, four days apart. Income inequality at a record low; food burden diverging sharply. Anyone can write either week's story truthfully and leave the reader with the opposite impression of what happened.
The reconciliation is not complicated once you see it. The bottom quintile's income rose faster than anyone's — because of transfers. Its composition of spending shifted toward things that cannot be deferred: rent, electricity, medicine, food. The gap that narrowed is in what households receive. The gap that widened is in how much of that is already spoken for before anyone chooses anything.
An Engel coefficient of 30.3 per cent against 17.8 is not a statement about income. It is a statement about discretion — about how much of a household's spending is a decision rather than an obligation. That is the real finding, and it survives every check we could run.
What we could not settle
Three things, stated because the piece is weaker without them.
Base effects. We could not obtain the bottom two quintiles' food spending for the equivalent quarter in previous years. If the base was unusually low, the percentage flatters itself. We looked and could not get the series; the agency's own board returned an error.
Composition. Korean income quintiles at the lower end skew heavily toward elderly one-person households, and quintile membership is not a fixed population. Some part of a year-on-year change is who is in the group, not what happened to them. This is well documented as a general feature; we could not find it quantified for this release.
Item-level volatility. The release publishes five items — rice +13.2 per cent, potato +11.1, spring onion +10.0, soy sauce +9.3, egg +9.0. Those are real and they are the numbers everyone quoted. But an item-level figure cut by income quintile rests on a thin slice of a roughly 7,200-household monthly sample, and we would treat any one of them with more caution than the coverage did.
August's consumer price index landed on Wednesday 2 September, the day after we published. Ten economists polled by 이데일리 had put the median at 3.2 per cent and called it the peak.
It came in at 3.1 per cent — back above three for the first time in two months, with core inflation at 3.4 per cent, the highest in three years and three months.
And the part that bears directly on everything above: agricultural, livestock and fisheries prices fell. Down 2.6 per cent year on year on the broad measure; the agriculture ministry's narrower agricultural-and-livestock basket was down 3.5 per cent. Agricultural products alone fell 6.7 per cent.
So the month that produced a national conversation about food prices crushing the poor was a month in which food prices, on the country's own index, went down.
Two honest qualifications, because this cuts in more than one direction. A large part of the headline rise is an accounting artefact: last August SK Telecom halved its customers' phone bills for a month as compensation after a hacking incident, and that discount lapsing is worth roughly 0.6 to 0.7 percentage points of this August's figure on the government's own account. Strip it out and the underlying number is closer to 2.5.
But the same release also shows the processed food increase widening, alongside durables — which is the category our piece on the food companies was about, and it does not let them off.
The government's response, announced alongside: a record ₩103 billion in Chuseok discount subsidies on agricultural, livestock and fishery goods, and a record 183,000 tonnes of nineteen essential holiday items released into the market.
What it says
We wrote a piece four days ago about Korean food companies raising prices while their own filings showed margins holding. The obvious sequel was: and here is who paid for it.
That sequel is not quite what the data supports, and the honest version is more uncomfortable. The supermarket is not where the bottom fifth absorbed this quarter. They absorbed it in the categories that do not make headlines — a fifth off education, nearly a tenth off anything resembling leisure — while healthcare and housing rose and the monthly shortfall stayed at ₩277,000.
A country can report a record-low income gap and a record-high food burden in the same week, both correctly, and produce a debate in which nobody is lying and almost nobody is looking at the same thing. The round number travelled. The line about education did not.
For the company side of the same summer — who raised prices and whether their margins justified it — see the same sentence used to justify opposite prices. For the fresh-produce spike that started the argument, and the scare number that turned out to be misleading, see what actually happened to Korean grocery prices.
Images. All three are charts we built ourselves from the second-quarter 가계동향조사: what rose and what fell for the bottom quintile; food-spending growth across all five quintiles with the Engel coefficients we could source; and the monthly shortfall. No photographs — we are not going to illustrate a piece about poor households with stock images of poor households, and there is no licence-clean Korean photography that would honestly depict this anyway.
Reported from the 국가데이터처 release of 27 August 2026 and the household-spending coverage of 30 August, read across 아주경제, 서울경제, 한국경제, 이투데이, 디지털타임스 and 헤럴드경제, with the bottom-quintile line items taken from 아주경제's itemisation of the release and checked against the others. A correction to our own earlier piece: on 27 August we described 통계청's renaming to 국가데이터처 as happening "at the end of last year." It took effect on 1 October 2025, when the agency was also moved to report directly to the Prime Minister. On originality: this is not unwritten in English — Seoul Economic Daily's English edition carried the quintile table, the Engel coefficients and the item-level increases on 30 August, the same day. What we have not seen anywhere, in either language, is the grocery-versus-dining split, the education cut, or the fact that the same release contains a record-low income gap. Deliberately not asserted: why eating-out spending rose 15 per cent for the poorest fifth, which we can describe but not explain; any figure for the Chuseok support package, which had not been published when we wrote this; and the "three times" itself, which we have declined to use as a number because the release does not produce it.
Keep Reading
More Stories

A Portmanteau Walks into a Party: In Defence of the Koreaboo
The word 'koreaboo' travels fast and lands hard — but nobody can define it, nobody who matters invented it, and it applies, with suspicious consistency, almost only to East Asian cultures. Drawing on the Francophile, the Anglophile, and a 1,555-day Duolingo streak, a guest essay on the double standard that calls Western cultural enthusiasm personality and Korean cultural enthusiasm a phase.
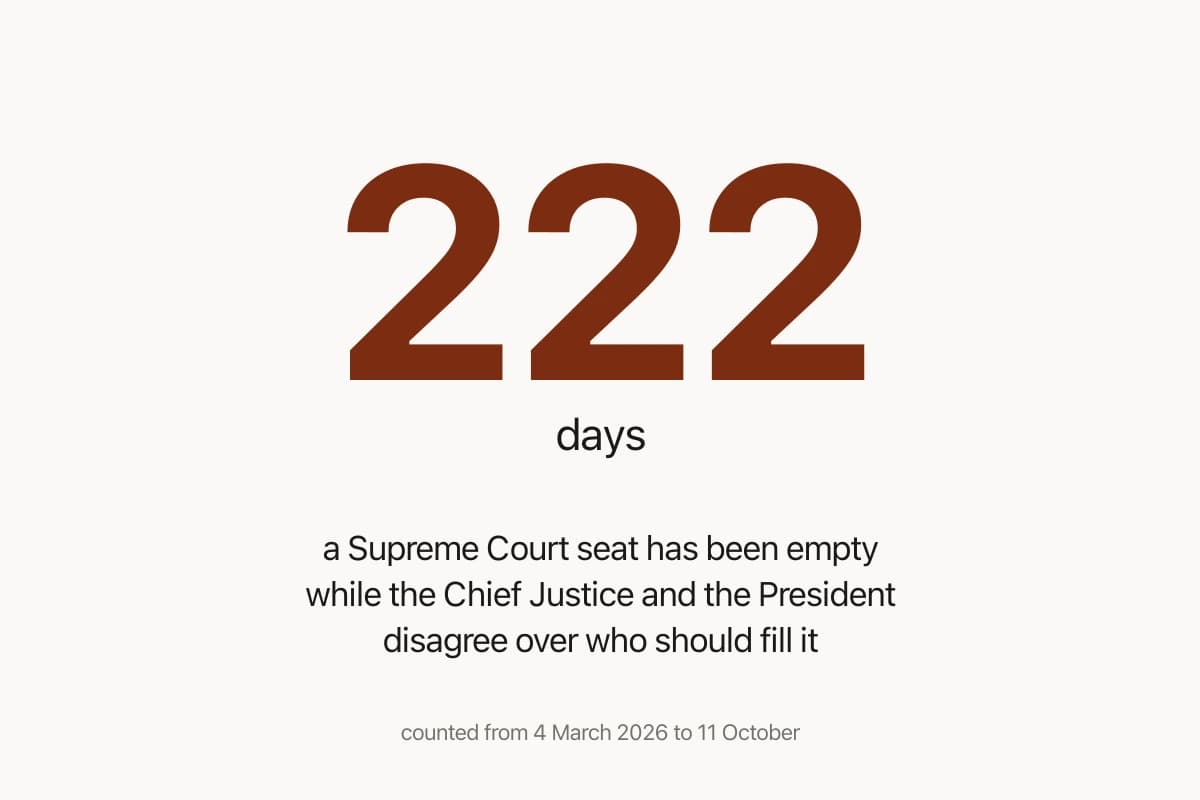
Summoned to Testify, Korea's Chief Justice Came, Refused the Oath, Answered Anyway — and Left at Lunch
On 6 October 조희대 sat before the National Assembly's judiciary committee for two and a half hours, unsworn, defending a refusal to put forward a second name for a Supreme Court seat that has been empty since March. Then the Chief Justice went, and came back at ten to eleven at night to give closing remarks. Nobody voted to compel a return, and the seat is still empty.
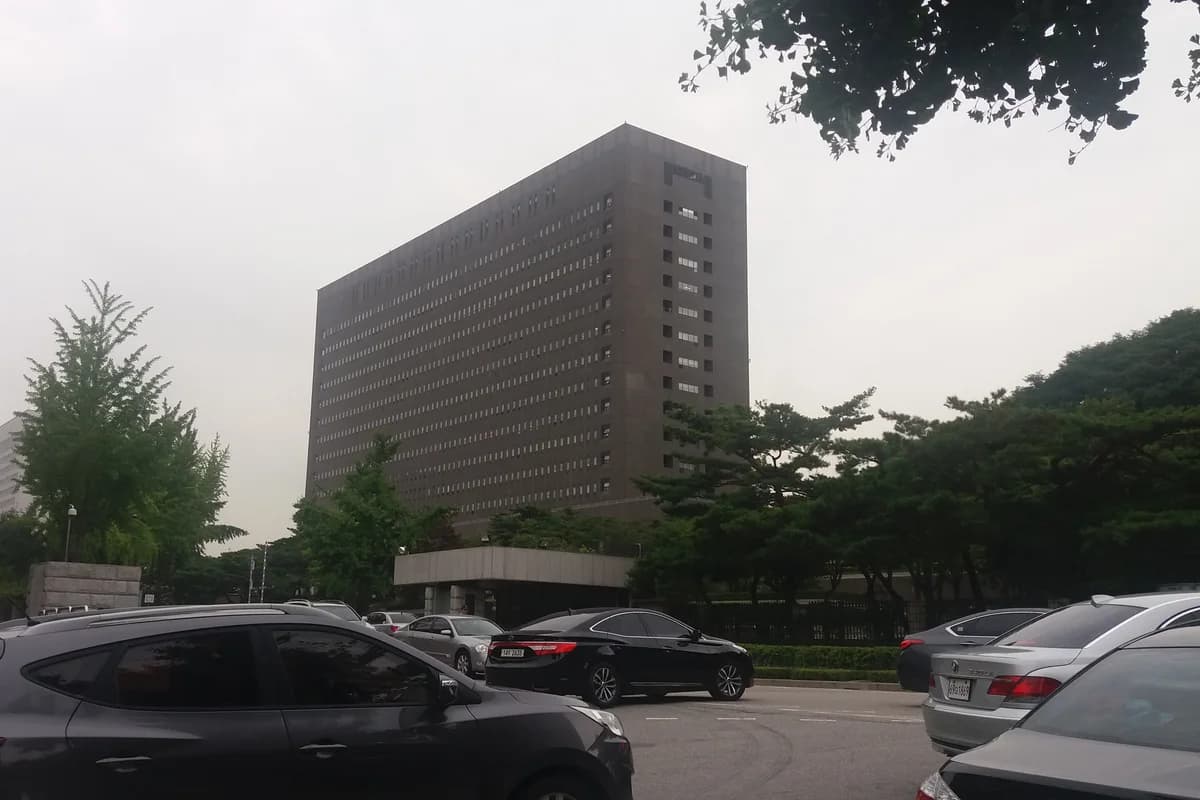
Korea Abolishes Its Prosecution Service on 2 October. One Successor Opens Without a Chief or a Finished Building. The Other Opens With the Same Prosecutors Under a New Sign
At midnight on 1 October the 검찰청법 is repealed and the institution that has dominated Korean politics since 1948 splits in two: a 공소청 that charges and tries cases, and a 중대범죄수사청 that investigates serious crime. It is the largest change to Korean criminal justice in seventy years, and it begins with acting heads at the prosecution office, the justice ministry and the national police, no head at all at the new investigation agency, seven sets of rules still unpublished, four challenges pending at the Constitutional Court — and the President arguing on X, in the small hours, with his own party about whether a former prosecutor may run the agency that replaces prosecutors.
The Weekly Dispatch
Korea, curated. Every week.
The best of K-culture, straight from Seoul. Written by people who actually live here.
Free, no spam, unsubscribe whenever.